Weight Loss Progress 2/21 (Things were going well then vacation happened)

Graph2-21Starting Weight: 175
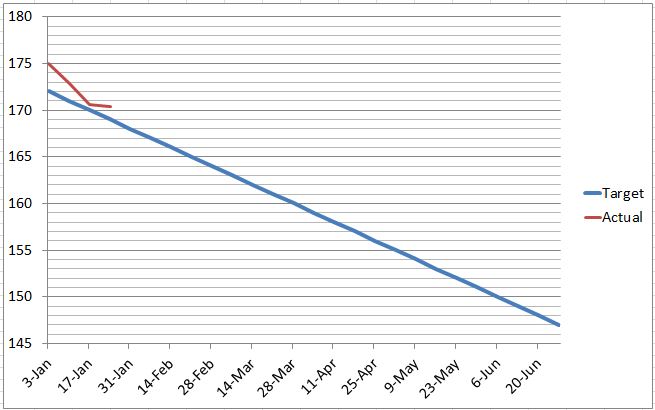
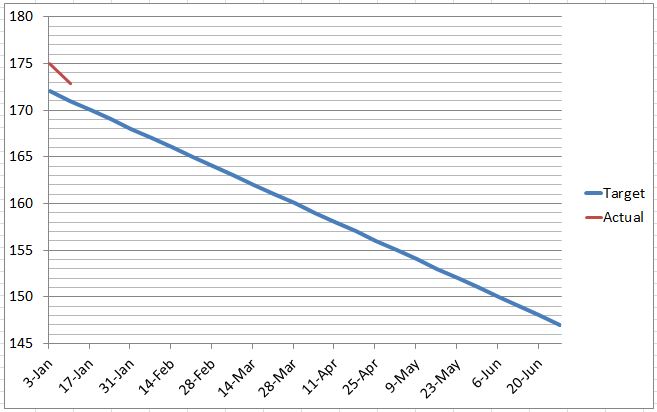
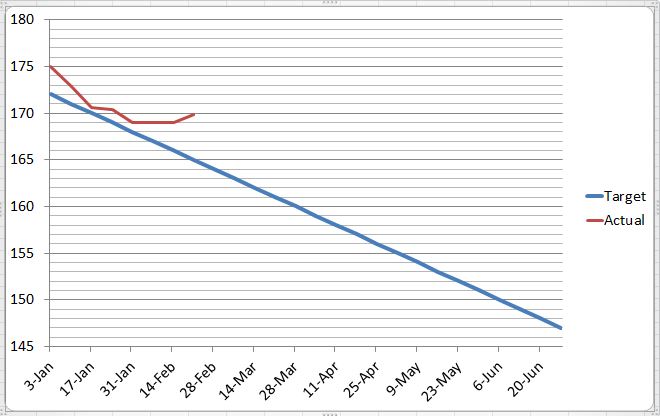
Previous Week’s Weight: 169 lbs
Planned Weight: 165 lbs
Current Weight: 169.8 lbs
Weekly Loss -0.8
Total Weight loss: 5.2 lbs
Body Fat %: 23.9


Obviously things aren’t going smashingly, but I am not overly concerned yet.  Things were going well, but the last three weeks have been hard due to vacation and then travel for work.  The first of those three weeks, I didn’t track the work outs and food as well as I had initially because there were a lot of things going on the week before vacation… last minute things to take care of, kids having unexpected days off from school, etc.  Week 2 was vacation, and even though I did run three of the five days on vacation… well, it was a vacation.  I was just happy that when I came back home, the scales were where I had left them. Week 3 unfortunately not monitoring and being vigilant has caught up to me.  Fortunately the scale only ticked up 0.8 of a pound.

So this week it’s back to close monitoring and getting back on track and the weight loss trajectory in the right direction.

Weight Loss Progress 1/25

Starting Weight: 175Capture_01-25
Previous Week’s Weight: 170.6 lbs
Planned Weight: 169 lbs
Current Weight: 170.4 lbs
Weekly Loss 0.2 lbs
Total Weight loss: 4.6 lbs
Body Fat %: 23.7

This week obviously wasn’t as good as the previous two weeks.  However, I was expecting it because I did let my diet and to a certain extent my exercise slide as well.  i did run as much as I had planned but I didn’t get around to doing the elliptical as I had planned.  In addition, I had a couple days of eating out where my caloric intake was greater than I had planned.  I also went out last Thursday and I didn’t manage that and the next day so well from an eating perspective.   One other things that also went down hill this week was my tracking calories.  Thankful that my overall trajectory was downward, and time to get back on the ball again!

I did however, buy a weight scale with a body fat measure on it.  So this will help me gauge my efforts using another directional factor.  As you can see from the current number it is slightly on the high side.  My goal, in addition to bringing my weight down is to get my body fat to about 14 percent initially.

Weight Loss Progress 1-17

Chart_01-17

Previous Week’s Weight: 172.8
Planned Weight: 170
Current Weight: 170.6
Weekly Loss 2.2 lbs

Estimated Caloric Deficit:7170
Actual Caloric Deficit: 5350

Second week of 2.2 pounds loss.  I was a little surprised since my diet was as controlled as I would have liked.  Went out for Mexican food for dinner on Tuesday as well as for lunch on Friday with co-workers.

On the exercise side, my running was more consistent, however, my elliptical dropped off since I didn’t manage my time in the morning well.  However, the elliptical was only for about 10 – 15 mins on M/W/F after interval training.  Also since my long runs overlapped this week (Sunday and Saturday) I’m assuming this helped make up for the diet as well as the elliptical.

I’m thinking I should probably buy a weigh scale with % fat measurement to give me one more measure to track.

Weight Loss Progress 1-10

Planned Weight: 172Chart_01-11
Previous Week’s Weight: 175
Current Weight: 172.8
Weekly Loss 2.2 lbs

Estimated Caloric Deficit:7170
Actual Caloric Deficit: 4395

This week, I lost 2.2 pounds.  My assumption however, is that some of this was due to the reduction of salt in my body due to not eating salty junk food, and  therefore not carrying as much water weight.  Especially since my actual caloric deficit doesn’t indicate the loss of 2 lbs.  However, it could be my inaccurate estimation of how many calories I’m taking in and how many I’m burning.  I’ll have to see how the next week trends to be able to better gauge how my estimates relation to my weight loss.   Hopefully

This week’s caloric deficit was less than I had estimated mostly due to the weather.  The temperature in Chicago hovered in the negatives in the morning with significantly lower windchills.  This kept me from taking the train and losing the approximately 40 minutes of walking per day.  In addition, two days, I had to shovel snow in the morning and wasn’t able to work out.  While I did burn calories shoveling, it wasn’t as much as having run or done HIIT with the elliptical.  BTW, god do I hate the elliptical.  I can run for 2 hours (like today) but 15 minutes on the elliptical and I’m struggling.

Food-wise I did okay.  I probably snacked a little more when I was home vs. working at the office, but it was still definitely less than what it had been in the past.

Overall I’m happy with this week’s progress.  Waiting to see what next week brings.

Creating a Weight Loss Risk Heat Map

When I think about when my unnecessary and extra caloric intake happens, it generally tends to be during idle time.  Infrequently it may be at lunch or dinner, but more often than not, it happens when in passing when I’m walking past the snack shelf at home, and also more often then not it happens when I don’t have planned activities.  This, not surprisingly, is also when I’m watching TV.

In order to recognize this risk that idle time leads to watching TV  which leads to snacks which leads to more calories which leads to unnecessary weight, I first needed to identify the times when I am most likely to have time for television or snacks.  In order to do that I created the following weight loss risk heat map in excel by creating a daily timeline and identifying times I generally watched TV and snacked.  Weight Loss Heat Map

This heat map gives me a good picture of the days and times I’m at a high risk of indulging (in red) and also times where I am at a moderate risk (in yellow).  Grey are minimal/no-risk times.

So what is the point of this heat map?  Understanding the days and times of high risk is the first step in helping me manage them better.  I’m planning on printing this out and posting on my refrigerator so that it is something I constantly see and am conscious of so I can make better decisions.  I know these times I will need to either find other activities or food alternatives to keep the extra caloric consumption to a minimum.  This will help me as I map out the food and activities for the week (in a future blog post).


Losing 24 pounds in 2015

imagesLosing weight is one of the most, if not the most, popular New Year’s resolutions every year.  So who am I to buck the trend?  l’ve set a goal to lose 24 pounds in 2015.  I know it sounds like a lot, especially for someone who currently weighs 172.  That’s approximately 15% of my current body weight and would bring my weight down to 148.  I know it will not be an easy task because weight loss has been a goal many times before and many times I’ve failed. The times I’ve succeeded my target weight loss has been less and it has been short lived.  This year, I’m hoping that the power of social media provides some pressure and motivation to keep me on track. So why 24 lbs?  According to the Ideal Weight Calculator at Runningtools.com this is my ideal weight.  But it’s not just some online calculator that I’m basing that goal on.  I’ve been down to that weight many years back and internally I know that is the right weight for my body type. My goal is to focus on losing about 1 pound a week over 25 weeks, which could bring me to my goal weight at the end of May.  Here is the baseline graph. Baseline Chart12-27
If you want to create a graph to outline your own weight loss goals and track your progress, you can download my template here – Weight Loss Graph.  I plan on updating this chart as well and posting relevant diet and exercise information on this page on a weekly basis.  I hope you’ll come back and check on how I’m doing!